Behind the Streams ▪️ Unser Autor Ivan Drobyshev hat die Elasticsearch Instrumente auf Herz und Nieren geprüft und gewährt uns detaillierte Einblicke in seine Erkenntnisse.
>> Elasticsearch ist Bestandteil der G&L Radio Distribution Plattform
◽ Dieser Artikel ist nur auf Englisch verfügbar.
Can Elasticsearch instruments help you identify log delivery/indexing issues? Let's find out by testing its Anomaly Detection and Classification tools against standalone models! Spoiler alert: built-in Elastic features are a viable choice in specific tasks, but that comes at a price.
Media content delivery generates a lot of logs. This is a fact well understood at G&L, since we facilitate the distribution of audio and video content, live and on-demand, for some major broadcasters and official bodies to end users. We know well that log data has no lesser commercial value than the content itself. Log misdelivery can lead to short-term profit losses for streaming and broadcasting service providers. These issues can affect advertising exposure assessment, long-term planning, and more. Providing accurate data and analytics alongside our core services is our dedication, duty, bread and butter.
Maintaining log consistency stands as a critical task. With log sizes fluctuating, especially during soccer tournaments or any other major events, distinguishing between normal situations and incidents, such as indexing errors or misdelivery, becomes crucial.
A noticeable part of CDN logs generated while distributing our customers' content is indexed to Elasticsearch 8.6.0. It incorporates two built-in features that hold promise for identifying consistency issues: Anomaly Detection (to identify an incident) and a classification model. We assessed both to determine their suitability for our customer’s needs.
No data, no fun
We began with a rich dataset of historical data encompassing around 2.5 months of minute-by-minute records, manually labeled as 0 ("ok / no worries") and 1 ("not ok / something's wrong") with 3-minute precision. We knew of a significant class imbalance, as only 4% of records belonged to class 1. Finally, for machine learning (ML) models, we eliminated timestamps to avoid data leakage.
First one out
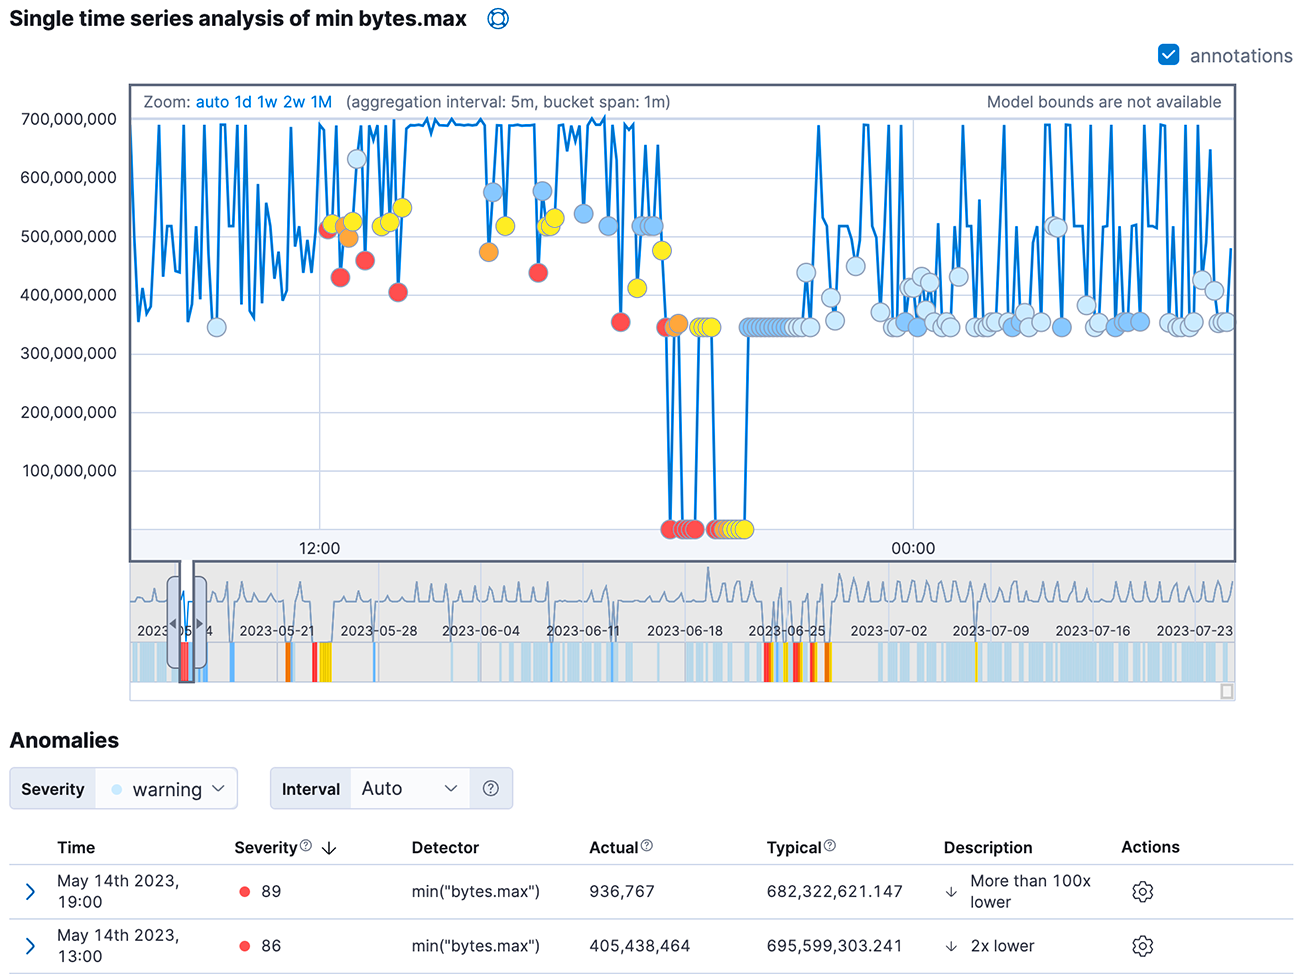
Anomaly Detection didn't make the cut due to its purely analytical (not predictive) purpose: to gain insights into the overall past picture. While its official documentation is a bit fuzzy, one can deduce that it measures absolute values being too far from a seasonal trend and pattern. When configured to observe minimal values in a bucket, it seems to be “more focused" on sudden drops in figures rather than peaks, which is exactly what we need. Yet, the method lacks sensitivity: from 26 "not ok" periods lasting anywhere from one minute to 34 hours, it marked somewhat precisely only 13 data points. We're choosing words carefully: the points, not the periods. "Precisely" means a data point lies at least within the incident period. Two more points came fashionably late to the "not ok" party. Sadly, the detection party completely missed the eleven "true anomaly" guests, and, in an awkward twist, tagged ten other points as party crashers ("false positives" in the world of binary classifications).

Fig 1. The Single Metric Viewer displaying results of Elastic Anomaly Detector job.
Only the central portion is related to an actual incident!
In other words, the Anomaly Detection tool from Elasticsearch may hint that some abnormal activity might occur at a specific moment. Whether it is true or not and the length of the period in question should be a subject of an additional manual check.
Machine Learning with Elasticsearch
The built-in ML functionality’s documentation doesn't exactly unfold the red carpet of clarity, but at least it drops the model type hint.
The ensemble algorithm that we use in the Elastic Stack is a type of boosting called boosted tree regression model which combines multiple weak models into a composite one. We use decision trees to learn to predict the probability that a data point belongs to a certain class.
So, a gradient-boosted decision tree ensemble. That's the only explanation we get. The pipeline probably doesn't rescale the features (as it may worsen gradient boosting-based model predictions) and may or may not weigh the classes to overcome the data imbalance. Who knows? Ah, the mysteries of proprietary magic! We get the following warning in the documentation, though:
If your training data is very imbalanced, classification analysis may not provide good predictions. Try to avoid highly imbalanced situations. We recommend having at least 50 examples of each class and a ratio of no more than 10 to 1 for the majority to minority class labels in the training data.
Speaking of imbalances: while we have at least 8290 data points for each class, our class-to-class ratio is an obnoxious 10 to 0.47 with prevailing class 0. Thus, we either rebalance the dataset or take ANY results from it with double suspicion.
Now, let's get down to business – metrics business. Since we'd want to minimize the number of False Negative predictions (an "0 / ok" prediction when there's an actual "1 / not ok" anomaly) while maximizing True Positive predictions, the following metrics were taken into account:
- ROC AUC score – a numerical whiz at quantifying the sensitivity-versus-noise dance. It's all about finding harmony between the True Positives and the pesky False Positives.
- Accuracy - a share of correct (True Positive + True Negative) predictions among all predictions.
- Recall - a ratio of True Positive predictions to (True Positives + False Negatives). It answers the question "How many relevant items are retrieved?" (thanks, Wikipedia, for the question phrasing assist).
The ideal (and rarely obtainable) score of each metric is 1. In Data Science, anything close to the highest score possible raises an eyebrow and urges a scientist to double- and triple-check the results instead of celebrating them immediately.
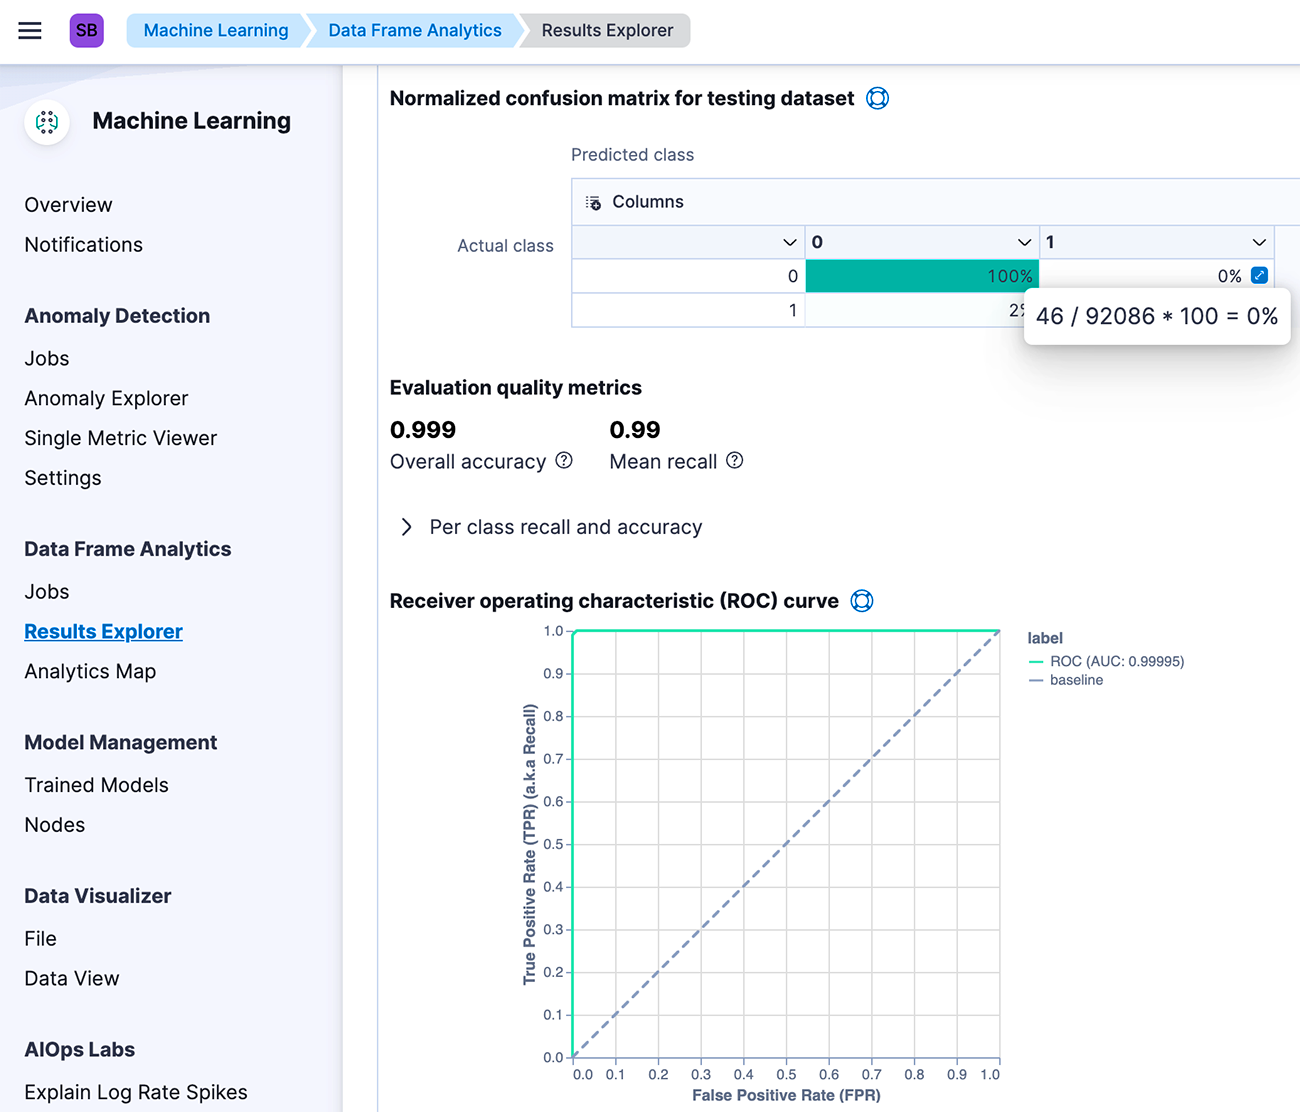
And that's what we had to do during our initial tests with the Elastic classification model. All three metrics returned results no less than 0.995! Okay, the dataset was labeled good (with the aforementioned 3-minute precision). The values of features varied significantly between classes, making the classification task supposedly easy to compute. Confusion matrices displayed some mis-predicted classes, yet the overall results seemed TOO impressive.
And to our utmost pleasure, log misdelivery/mis-indexing is a rare event, so no validation subsample is available so far. The only way to validate it was to run through all procedures with all sets of different samples with balanced classes, try datasets with and without multicollinear features, and finally recreate the same protocols on standalone models running in an environment 100% independent from the Elastic stack. And not to forget the colossal class imbalance comparable to the world freshwater-to-saltwater ratio: no matter what you calculate, the sheer amount of the majority class clouds any assumptions and conclusions.

Fig 2. Metrics and a confusion matrix from the Elastic classification model.
0% errors are not equal to 0 errors!
When results are too promising
Just to give an overview of what we did to retest the findings:
- Removing multicollinearity by deleting correlated features.
- Undersampling the majority class to match the minority.
- Upsampling the minority class with synthetic records (the SMOTE technique) to two different values.
- Running each procedure in Elastic, and then doing the same using Python implementations of Logistic regression (with feature rescaling), Random Forest classification, and alternative gradient boosting on decision trees from the CatBoost library. The class weighing was not forgotten too.
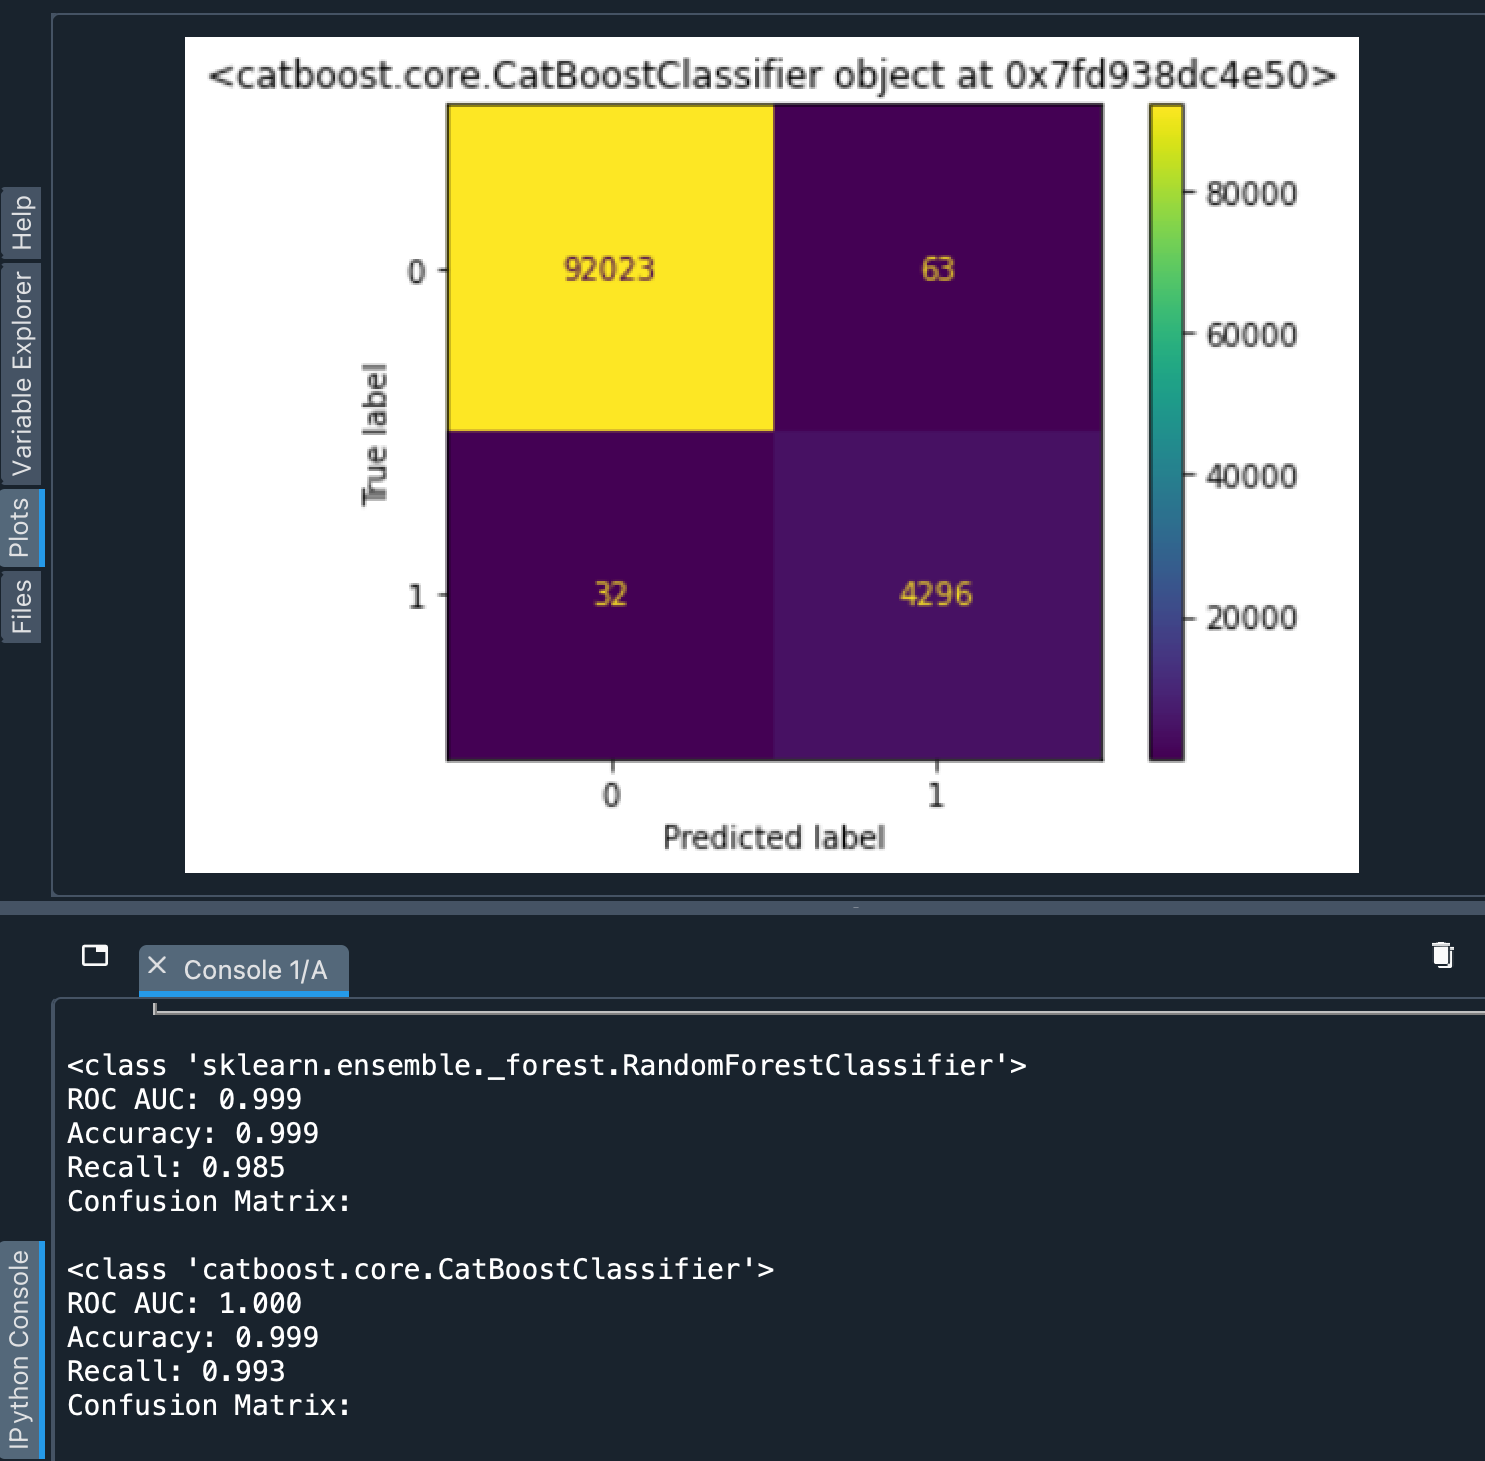
The results obtained with standalone models were coherent with our prior findings from Elastic and even exceeded the latter with lower numbers of False Negative predictions. On the downsampled dataset, all three metrics displayed values no less than 0.995. On the complete sample, the Recall value went as low as 0.985 (which now seems a bit more realistic), while other metrics remained 0.995+ -high. But as we learned from class-balanced tests, this is possible, and isn’t necessarily a sign of the model being overfitted.
 Fig 3. Metrics and a confusion matrix from standalone models.
Worse metrics, better absolute values.
Having worse confusion matrix figures and better metric values from the Elasticsearch tool is a bit confusing. The only plausible explanation is some tricky Elastic metric calculation procedure, whereas independent models were evaluated with tools from the open-source scikit-learn library widely accepted in the Data Science community.
So, is Elastic ML any good for anomaly detection?
Elasticsearch offers a good entry-level solution for classification problems. Its performance on well-labeled data is enough to identify continuous series of an event, a category log misdelivery and indexing issues fall under. The user-friendly Kibana interface provides means to get the model ready (train it) without extensive prior knowledge of ML libraries and environment (being familiar with general concepts might be handy, though). Deploying the model so that it would detect incidents in real time requires a more in-depth understanding of Elastic operations. Nevertheless, those operations are managed from the same Kibana interface (or corresponding APIs), using the same stack: no additional software, plugins, scripts, etc.
What's the catch, then? Isn't that ideal?
Well, let's start with the fact that ML instruments are available only with "Platinum" and "Enterprise" subscriptions. Free license users must rely solely on standalone models with their own stack and resources.
Also, there's a trade-off: lower performance. Yes, the metrics are incredible! Yet, confusion matrices show that native Elastic models may be more likely to give false alarms or miss an actual anomaly. Luckily, log misdelivery/mis-indexing is rarely a single discrete event. Its consecutive nature mitigates the risk of missing an incident: at least some of the abnormal values in a series will be detected.
When there's a need to identify more discrete standalone events that generate a single log message, one might want to rely on other tools independent from the Elastic stack. In our experience, the CatBoostClassifier outperforms any other library, even without hyperparameter tuning. Yet, any open-source library of choice offers more controllability and transparency, which proprietary solutions often lack.
What did we choose for our application? After giving it a long thought, we went down the third road. We recently started a project to improve our log metadata collection pipelines. We know from first-hand experience that log misdelivery can be identified from this metadata. The tests we performed on Elastic built-in instruments and standalone models made it clear that implementing a single computation-costly feature would require some effort. So, we decided to take a whole other approach. But that's a story for another article.
Der Autor
Ivan Drobyshev
Business Data Analyst
Ivan startete seine berufliche Laufbahn als Erziehungswissenschaftler mit psychologischem Hintergrund. Nach einer zehnjährigen Lehr- und Forschungstätigkeit im Bereich Sozioökonomie, widmete er sich seiner aktuellen beruflichen Leidenschaft – der Datenwissenschaft und -analyse.
